
Zoning code violations—such as illegal signage, unauthorized structures, or improper land use—often go unnoticed until they escalate into larger community or legal issues. The City of Kings Mountain faced challenges with traditional methods of reporting, including paper logs, phone calls, and spreadsheets. These lacked spatial context, consistency, and efficiency, leading to delayed enforcement and missed opportunities for proactive intervention.
To modernize this process, we leveraged the city's existing Esri’s ArcGIS Online ecosystem and implemented a Survey123-based mobile solution for real-time zoning code enforcement. This system enables zoning officers to capture, track, and manage violations efficiently—right from the field.


Our Approach
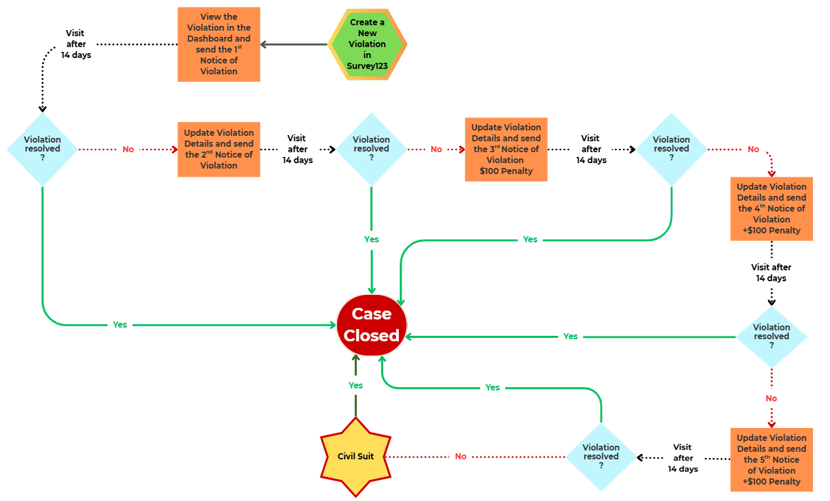
We approached the requirement by designing a flow for the City and having it validated against the legal codes and processes followed in North Carolina
1. Smart Form Design with Survey123 Connect
We created dynamic, logic-driven forms using Survey123 Connect to ensure the staff collects high-quality data. Key features include:
-
-
-
-
- Conditional visibility logic to display only fields relevant to the violation type.
- Auto-captured GPS and time stamped photos for stronger legal documentation.
- Persistent visibility of historical violations, allowing field staff to track unresolved cases.
-
-
-
This approach minimized data entry effort while maximizing quality and consistency.
2. Field Deployment with Mobile Devices
Zoning officers were equipped with tablets running the Survey123 mobile app. With built-in GPS and offline capabilities, officers can:
-
-
-
-
- Locate the violation with ease.
- Capture photos and notes, even without cellular service.
- Document issues in real-time.
-
-
-
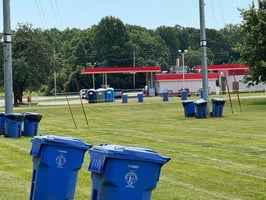
 Survey123 Field App used for recording Violations
3. Report Templates & Smart Web Maps
To streamline backend processing:
-
-
-
-
- We developed a simplified Web Map that shows only essential violation data.
- Integrated pop-ups link directly to Survey123 Reports, auto-generating notices tailored to each case.
- Created a Smart form for editing with conditional visibility, smart calculations and notes that reduced the editing time per feature by up to 50%.
-
-
-
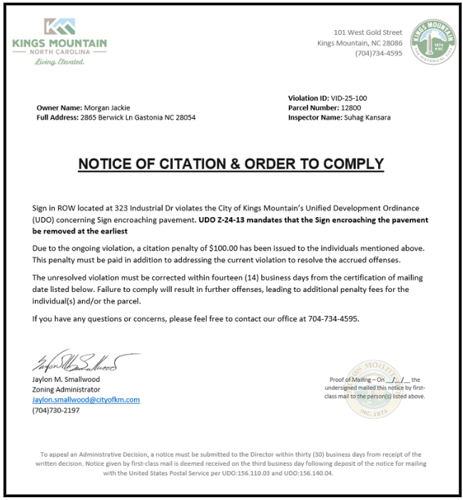
Notice Template generated in the Dashboard
4. Real-Time Monitoring with Dashboards
Submitted violations are automatically pushed to ArcGIS Online. We configured a comprehensive ArcGIS Dashboard that enables:
-
-
-
-
- Mapping of violations by type, location, status, and last inspection date.
- Filtering and tracking of open vs. resolved cases.
- Generation of customizable violation letters directly from the dashboard.
- Status alerts for overdue inspections or compliance deadlines.
- Dynamic indicators and lists using Arcade expressions, reducing manual review by stakeholders.
-
-
-
Why Survey123 Was the Right Fit
Survey123 was the ideal tool for this workflow due to its:-
- User familiarity: Field staff were already trained in Survey123, reducing onboarding time.
- Form-driven design: Perfect for structured inspections like zoning enforcement.
- Built-in validation: Smart logic ensured high-quality data collection.
- Legal defensibility: Every submission includes geolocation, photo evidence, and timestamps.
Key Lessons & Tips
- Keep Forms Simple
Use logic and constraints to reduce visible fields—minimize clicks for the field team. - Use Smart Defaults
Auto-populate fields like date, inspector name, and location where possible. - Test Report Templates Early
Save and test your report templates frequently to avoid surprises during production. If you are getting started with reports, we always recommend checking this post by Ismael Chivite: Understanding Survey123 Feature Reports - Avoid Dashboard Clutter
Group visualizations logically. Use tabs or categories to keep it digestible. Use actions to reduce categories with no data to avoid confusion. - Leverage Arcade to create Data Expressions
Calculate inspection due dates, highlight overdue cases, and surface high-priority issues—dynamically in indicators or lists based on the current date. For a great starting point, check out this blog by David Nyenhuis: Getting started with advanced formatting using Arcade in Dashboards - Visualize & Color Code
Visualize data with unique values and provide color coded texts to get quick insights. Using Arcade to format your list can make a huge difference. Here is an example: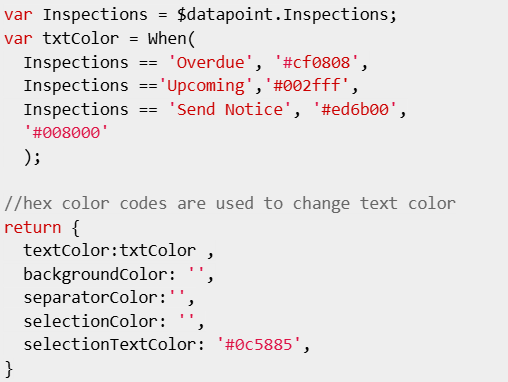
Watch a short video to understand our process

.png?height=200&name=Suitability_1%20(1).png)

Submit Your Comment